An uninhibited, no holds barred argument for proportional representation
What follows is not a disembodied academic analysis, but an unabashed plea born of decades of observing the distortions in our electoral system and the machinations that have derailed every attempt to reform it.
by Maurice Y. Michaud (he/him)
 Not surprisingly, those who have never studied electoral systems nor looked as I have, without bias, at the results of all the elections ever held in Canada tend to opine freely but very superficially on the matter of electoral reform. I offer as evidence the comments section of this article that appeared on CBC News
  shortly after the 2015 federal election. Just as everyone suddenly seemed to become epidemiologists during the COVID-19 pandemic, we tend to assume that we know the minutiae of our electoral system because we all know how to cast a ballot. But, in fairness, I need to remind myself that, along with Éric Grenier and Philippe J. Fournier, I am probably one of the few Canadians who is crazy enough to have recorded and pored over all those results in detail — with apologies to Éric and Philippe for somehow suggesting that they are crazy, which they are not!
I completely agree with Dennis Pilon, the York University political science professor quoted in that 2015 article, that this matter of changing our electoral system should not go to a referendum. The group Fair Representation in Canada holds the same view. And yet, I sense that this idea makes you uncomfortable. But give it some serious thought...
- Were you asked for your opinion when FPTP was chosen for our elections?
- Or were you asked for your opinion when multi-member ridings were abolished between 1967 and 1991?
You might be saying to yourself, “Oh, come on, Maurice! I wasn’t even born back then!” To which I reply to you: “Surprisingly enough, neither was I... at least not when the changes that could have affected me were taking place.” However, I was around when several Canadian jurisdictions, including the federal government, examined and even proposed a shift to a proportional electoral system, and I followed the deliberations as closely as I could. I witnessed how the staunchest opponents of PR didn’t really listen to the arguments for or against it; instead, they kept harping on the idea that a referendum was mandatory if we were to change our voting system. And, particularly at the federal level, they kept invoking that it was a constitutional change.
But there’s a slight problem with that... Yes, the rules determining how many seats and how seats are allocated to each province are enshrined in the Constitution, but there is no mention of the electoral system itself. Electoral ridings are geographically redrawn after every redistribution, and the number of members each riding will have is specified. Nowadays, the ratio is always 1 member to 1 riding, but back when multi-member ridings existed and obviously required a different electoral system, that system was still not mentioned in the Constitution. In other words, these opponents were trying to stall reform by positioning themselves as defenders of democracy, yet they did so by raising a point completely unrelated to the core issue at hand — a classic red herring. It’s almost as bizarre as if you asked me to bring you a cup of coffee and I replied, “I’m putting on my glasses.”
This leads me to suspect these people of acting in bad faith. For the fact is, it is not out of disdain for democracy that Professor Pilon, Fair Vote Canada, and I propose that this issue not be handled by referendum, but rather through administrative rigour. Historically, the choice of our electoral mechanisms has always fallen within the legislative realm, not the constitutional realm. Indeed, when Parliament abolished multi-member ridings between 1967 and 1991, it did so through legislation, without a referendum, because the matter concerned the mechanics of the vote, not a restructuring of powers within Confederation. And even when the federal redistricting process in the early 2020s threatened to cost Québec a seat, MPs simply passed a law changing a single date in the Constitution to stipulate that Québec could not have fewer seats than it held during the 44th Parliament — as has always been done.
But when we finally find the courage to talk about electoral reform again, we will have to be careful not to fall into traps. As I mentioned in “Changing our actual system?” there are electoral systems that are worse than FPTP. Sorry for being simplistic, but any majoritarian system is bad. Period! Full stop! Instant runoff/Alternative voting is the worst, though, not because it is favoured by the federal Liberal establishment but because of math! While it is true that each person elected under this system can claim — thanks to some fancy mathematical scheme — that they obtained a majority of the votes in their riding, when the tally of the seats happens afterwards, the results are even more lopsided than under FPTP. Sadly, the people of the Yukon voted in November 2025 to change to an IR/AV system after being presented with a flawed binary choice. Perhaps the only saving grace is that the Yukon Party government opposes it, highlighting how majoritarian systems consistently end up paralyzing themselves.
That is why we must be careful whenever the appetite to replace FPTP increases, as we could be at risk of using bad tactics or of changing for change's sake and making matters worse. However, perhaps what bothers me the most is that the Law Commission of Canada had already studied the matter in 2004 and had come up with an excellent “Made in Canada” solution, so why did we try to reinvent the wheel in 2015? There are more ridings today than there were back in 2004, but the underlying mathematical framework and structural recommendations in that report remain entirely scalable and valid. Alas, that important work, which we as tax-paying citizens had already paid for, was shelved after it was submitted because its proposal did not align with the preferred system of the party in power at the time, which, regardless of political stripe, would stand to lose a bit of power if the system were actually — by golly! — fair!
Despite their good intentions, even some who advocate for proportional representation, as well as some journalists who attempt to explain what PR would look like, can simplify the argument too much. They only look at the percentages of the popular vote across the jurisdiction and translate that percentage into number of seats. Instead you should spend some time at Fair Vote Canada, because they know what they’re talking about! They understand that Canada is a big country with extreme regional differences politically.
Because you see: first, in 1993, 2015, and 2025, many voted Liberal “strategically” in those federal elections because of their intense loathing of the incumbent government (or, in 2025, in a quest to determine who would be the best prime minister to confront the return of Trump to the presidency of the United States) — that is, even though they did not need to do so. Why not? Because they were already represented by a non-government member of Parliament, and the voting trends in their riding over the last 20 years did not suggest that would change. (The example of the NDP’s Megan Leslie in Halifax in 2015 comes immediately to mind.) As a result, the percentages of the popular vote for the main and even some minor parties were an aberration and not indicative of a sudden love affair with the Liberal Party. Secondly, if we had two votes — one for our local MP and one for our preferred party — we would not feel the need to vote “strategically.” For instance, one could easily vote Liberal or Conservative locally but for the Greens (or whatever else) on their party ballot.
Once the seats won by regular FPTP would have been counted (which would be the majority of them), then the popular vote by party would be examined. The parties that met the minimum threshold, but did not perform as well in the FPTP races, would get “compensatory” seats to bring them closer to the popular vote they obtained. The final results would not be perfect and would only be as good as the system’s design and the method used to allocate those remaining seats, but they would certainly be closer (and fairer) than any FPTP election could yield.
But I am particularly tired of opponents’ simplistic or partisan arguments against proportional representation. By this, I mean instances where someone singles out elections where FPTP worked against their party — for example, where their party won the popular vote but secured fewer seats than the winner — while failing to mention the cases (sometimes numerous) where the system worked in their favour. Or, alternatively, when someone constructs an argument for the status quo based on a “long electoral tradition that has served us well for over a century” while hiding what they’re really thinking: that they know proportional representation would harm their political party or their vision that prioritizes majority governments at any cost. I believe I am tired of such arguments not only because they are boring, but above all because they often rely on cherrypicking, are driven by political calculations that treat the electorate like children, and amount to intellectual dishonesty by deliberately concealing contradictory facts.
We have some pretty colourful polemicists in Québec, but this one in particular, who happens to oppose PR, is especially guilty of that sin I just mentioned. Juxtapose someone like him to Chantal Hébert who, granted, is not a polemicist, but who is capable of calling the good and the bad shots by whomever, regardless of their political stripe, who has the ability to allow her thoughts to evolve, and who avoids the facile conflations that other analysts struggle to resist. Fortunately, if the arguments of opponents of PR have holes big enough to drive a truck through them, then it should be easier to champion the cause — provided we can ruthlessly dismantle their flimsy arguments.
So without further ado, let’s get at it!
- “PR would open the door to too many fringe parties.”
- For you, it’s always about those weirdos who don’t think like you, isn’t it?
If you had been listening more closely, you would have heard that everyone agrees that the proportional systems in Italy and Israel are hot messes. The reason why the PR systems in all the other countries work is because they are designed with a minimum threshold to determine eligibility for compensatory seats. The majority of the seats — from 55 to 75 percent, depending on the system’s design — are still won using the FPTP method you know well. So if a party happens to win one or two seats that way, a bit like how some independents succeed today, then good for them! But if overall they only obtained 4% of the popular vote, that’s all the seats they will be getting this time. So:
- To those lucky elected members through FPTP: Congratulations and enjoy your seats!
- To those who oppose PR on these grounds: Your problem was? Oh, never mind... Problem solved!
A minimum threshold to obtain compensatory seats is the “magic” ingredient to make this PR recipe work. Without one, and had the 1993 federal election been held under an Italian- or Israeli-style PR system, by virtue of getting 84,743 votes nationwide (i.e., 0.62%) and 21 best finishes in fourth place, the loony Natural Law Party might have won a seat in the Commons. Can you imagine? But with a threshold of just 5%, given that 100% of the votes for the Bloc Québécois came from Québec but that the votes obtained by the Reform Party came from everywhere else, Reform would undisputably have been the Official Opposition in the House, while the Progressive Conservatives — who after all did get well over 2.1 million votes or 16% nationwide (or only 372,823 fewer votes than Reform) — would have been directly behind them with perhaps 49 or 50 seats instead of only 2, then followed by the Bloc Québécois. The following decade might have been less tumultuous on the right of the political spectrum and the factions might have kissed and made up well before late-2003.
It’s because of this kind of vacuous argument that I believe this matter of changing the electoral system should not go to a referendum. We must deny opponents of PR the opportunity to indulge in groundless arguments so that we can expend our energy on demonstrating why PR is better and not a scam, which might take some convincing with a public whose cynicism towards politics can make them prone to falling for such easy, sensationalistic and spurious arguments. I say that not because I think the public is stupid; rather, I think most people have other priorities, lead busy lives and, as any political commentator worth their salt will tell you, do not pay as close attention to every twist and turn and pseudo or real scandal as they do in the “chattering class.” I mean, I confess that I never read any political party’s platform at election time, yet I would not refute being labelled a political junky! So it’s on that premise that I am expressing the need to defend PR without the interference from silly partisan distractions that would inevitably come with a referendum.
- “Wait a minute... ‘Compensatory seats?’ You mean there would be more elected officials?”
- There is no appetite for bigger government.
Again if you had been paying attention, you would have heard that the PR systems that have been proposed in Canada in recent years suggest that the number of seats in the legislature would remain the same or be only slightly higher.
The electoral map would obviously need to be redrawn. The “local” ridings would be larger in order to have fewer ridings and voting in those ridings would still use the current FPTP system. But then, clusters of local ridings would form “regional” ridings, and the sum of all the ridings would be equal to the current number. Therefore, people would have two votes on election day: local and regional.
Those regional seats would be the compensatory seats. They would be assigned to the parties meeting the eligibility threshold to correct the percentage gap, as much as possible, between the popular vote they obtained and the number of seats they won locally through FPTP. The fewer regions there are — the more ridings are clustered into a region — the better proportionality will be. So:
- To those who vote: You would have two representatives instead of only one, yet there would not be more people in the legislature.
- To those who oppose PR on these grounds: We actually agree that we do not need more elected representatives.
Some PR systems have actual “top-up” seats that are created to ensure perfect proportionality and then those seats are eliminated if they are no longer needed after the following general election. But our system does not have to be like that. We can aspire for a system that is simply more proportional than the one we have now which, when coming from FPTP, is not that hard to do! And if one party happened to have been very successful and won most of the local races (and thus would not need compensatory regional seats), there might not be enough regional seats to completely eliminate the gaps for all the other parties, but at least the gaps would not be as severe.
- “Giving voters two ballots? No, no, no... They’ll get confused!”
- Do you really think people are stupid or are you just bent on making things up?
There is nothing confusing about asking people to vote more than once. They are already doing it at the municipal level. Heck! I am in Montréal and municipally, where we actually have a party system, I have to vote for a city mayor, a borough mayor, and a councillor or two. It’s not rocket science and all the research on electoral systems that I have done does not give me an edge over everyone else in grasping what I am asked to do! What’s more, although we use the FPTP system, I can vote and have voted for different parties on different ballots. So:
- To those who vote: Don’t worry, you’ll be fine. You’re already doing it.
- To those who oppose PR on these grounds: Don’t worry, they’ll be fine. They’re already doing it.
This is by far the weakest argument that some opponents of PR try on, but since it gets dismissed very easily, they then try to tackle their “PR is too complicated” narrative from other angles.
- “Local seats. Regional seats. Assigning those compensatory regional seats... It all sounds so complicated!”
- Good thing you are not the one in charge of counting the votes! Sorry, sorry... but let me tell you a little story...
When I was an undergraduate in what was essentially an arts program, I had to complete a full-year course in statistics. I was not horrible in mathematics, but I certainly did not consider it my strength academically and I was worried about being at a disadvantage because I had studied maths in French in high school and the program I was in was taught in English. Therefore, I was terrified of that course! I worried I would do badly or, worse, fail and have to take the course twice.
Then, a friend of my roommate at the time, who happened to be an engineer, gave me the best advice anyone could have given me. “Don’t try to understand why a formula works,” he said. “It’s been tried and true and tested millions of times, plus you’re not expected to memorize all the formulas. You just need to figure out which one you need to prove or disprove your hypothesis.”
He was absolutely right. At each exam I was allowed to bring in one page on which I had scribbled down all the formulas we had learned. Thus the challenge was to figure out when and why I needed to apply this formula rather than that formula given the hypothesis that had to be demonstrated as “statistically significant” (or not) with the data that was given.
My final grade in statistics was 90%. I totally aced my dreaded stats course!
Sorry for the put-down about you not being the one counting the votes, but what I was trying to say it that it is really not that complicated — certainly less complicated than full-on stats! The only “complication” is that there would be two sets of votes to count instead of only one but that is not a big deal, especially in an era when the smartphone in our hand holds vastly more computational power than the desktop computers of 1992 — not that we would be using unsecured smartphones to count votes. Plus proportional elections, often with far more complicated counting schemes than the one I am arguing for, have been held around the world for decades, meaning way back when all the tabulation had to be done by hand. So:
- To those who vote: If they can do it in Albania, Belgium, Bolivia, Bulgaria, Denmark — do you want me to continue? — Estonia, Fiji, Finland, Germany, Spain — okay, I’ll stop! — we can most certainly do it in Canada, eh?
- To those who oppose PR on these grounds: You are either making an effort not to understand or simply scaremongering.
We must get past our fear of the unknown. That which is unknown to us is in fact well known in many other countries. It is time for us to catch up with them.
- “Those bigger ridings will mean people will be less represented, especially in rural areas.”
- That statement is simply not true — neither now nor when PR would be implemented.
Ridings (or electoral districts) are one area in which proportionality already exists, with exceptions granted for very isolated or large rural areas, in an attempt to meet the criterion of “One person, one vote.” The idea and the ideal are to make each person’s vote carry roughly the same weight no matter where it is cast.
It’s important to remember that this notion did not always exist in Canada, for indeed, in the 19th and early years of the 20th century, only men 21 years of age or over who met certain land ownership criteria were given the right to vote. Universal suffrage was only granted federally in 1920, with some provinces like Manitoba granting it as early as 1916. By that I do not simply mean that women were finally allowed to vote, but that the ownership criterion was also dropped. Even there, Chinese Canadians were only granted the right to vote in 1947, and indigenous peoples in 1960. The voting age was lowered to 18 federally in 1970.

©
Photo 2016 Angus Maguire via Interaction Institute for Social Change — Fair use
It is only by the early 1960s that most jurisdictions redrew their electoral map to redress this urban/rural inbalance. While one could take a map and coldly ensure that each riding has the same number of people, doing so would not take into account natural affinities between bordering communities. For instance, do the people of Leduc County, Alberta, relate more to Edmonton directly to their north or to the more rural area of Wetaskiwin directly to their south? If Leduc, given the number of ridings that needed to be created, had to be included in one or the other, which would it be? Following the 2012 federal redistribution, it was decided, given the number of ridings allotted to Alberta, to place it in a riding that was named Edmonton—Wetaskiwin, but when the 2022 redistribution gave the province three more ridings, it was placed in the new more rurual riding of Leduc—Wetaskiwin.
A population variation of x% is allowed to address this kind of dilemma, not to mention that there can be the notion of “protected seats” in some jurisdictions to respect significant historical and cultural minorities in some communities, as well as isolated areas which may have very few residents compared to their very large territory. Although in Québec it may make sense mathematically to merge Ungava with one of its neighbouring ridings to the south, pity the person who would have to represent that riding, which would cover even more thousands of square kilometres, and the people that person would have to represent!
So before Conservative supporters in the federal riding of Kenora (Ontario) start comparing their riding to the one in Québec that was held by the prime minister (Papineau) and complaining that they are underrepresented because “Québec, as usual, is always overrepresented,” they should consider this. In the 2021 federal election, there were only 46,382 eligible voters in the Kenora riding which covered 321,741 square kilometres for the 72,972 eligible voters in the Papineau riding which covered only 10 square kilometres. The notion of equity had already been applied to Kenora because we, as fair-minded citizens, recognized the challenges faced by rural residents and those who represent them.
Therefore, to come back to your point: In addition to the efforts already made to ensure that rural areas are represented equitably, a PR system would then cluster the redrawn local riding of Kenora with other northern Ontario ridings to create a region for which one or more regional party seats would be assigned based on the popular vote. Depending on how the results in the local FPTP ridings played out, there could be additional regional Conservative members, or members of the Liberal Party, or the NDP. And let’s say, for the sake of argument, that one of those regional seats went an NDP member because that party came a relatively close second regionally yet did not win any local seats in the region, the constituents in Kenora who identify more with that party than the Conservatives would have a representative with whom they might feel more comfortable to address their concerns. So:
- To those who vote: You would in fact have two representatives, with possibly one of them sharing your political beliefs.
- To those who oppose PR on these grounds: Rural areas would in fact be more represented than they are now even though they already are more represented than urban areas out of concern for equity.
In short, it is important not to just look at the electoral map after an election, get blinded by huge expanses of a certain colour, and wonder why that party did not win more seats. For instance, seeing Nunavut in orange hides that, although it is 209,319 times bigger than Papineau, which is imperceptible on that map, it has less than one quarter of number of eligible voters in Papineau. Of course, Nuvanut/Papineau is the second most extreme example I could take — Toronto Centre would be the most extreme — but all those sparsely populated huge ridings that cover the map can act as a trompe-l’œil. Saskatchewan and Manitoba: huge blocks on the map but, outside Regina, Saskatoon and Winnipeg, very few people to go to polling stations!
- “PR puts too much emphasis on parties. Those regional members would be accountable to their party, not their constituents.”
- Not quite true, but at least this time you’re bringing up a point worth discussing.
You are bringing up the valid debate about whether, on that second ballot, the list of candidates should be open or closed. An open-list ballot would be one on which you could pick an individual under a party heading. On a closed-list ballot, you would only vote for the party you support and, under the party’s name, you would see the names of the individuals in the order they would be called upon to occupy a regional seat, as needed: the first person listed would get the first seat, the second would get the second, and so on.
You could reasonably argue — and I would tend to agree with you — that with a closed list, the parties would have elected their regional candidates, although let’s not forget that, usually, candidates go through a nomination process, which means that parties already and always have a say on who will represent them. However, there would not necessarily be nefarious intentions behind the ordering of those candidates. It might be to ensure gender balance. It might be to reflect the region’s cultural diversity. But yes, there could also be nefarious intentions, like a party really wanting to have a particular person elected but who, for whatever reason, might not be electable in a regular FPTP contest.
That is why I tend to prefer an open-list ballot. It would indirectly allow us to decide the order in which candidates would be called upon, and it would assuage your feeling (and mine) that we would not have elected those regional members — that they would have been imposed on us by the parties. The downside — and it is not a minor one — could be that not as many women or members of some significant community within a region would get elected. So:
- To those who vote: Based on this explanation, which type of list would you prefer: open or closed?
- To those who oppose PR on these grounds: That concern you raise can be addressed, as long as you don’t just shut down the discussion with this argument.
Beyond deciding whether the lists should be open or closed, other points will need to be considered:
- Can a person appear simultaneously on a local and a regional ballot?
- Must the individuals appearing on a regional list be residents of the region, or could they appear on multiple regional lists?
- What would convince parties not to view regional lists as receptacles of what they consider second-tier candidates?
If I’m choosing not to make a definitive call on these delicate mechanisms here, it’s not to avoid them. It is because the history of failed reforms in Canada teaches us that getting bogged down too early in these technical minutiae is the surest way to derail the consensus on the very principle of PR. Everything in good time.
- “Coalition governments would become the norm because no party could ever form a majority.”
- And how exactly would that be a bad thing?
Clearly, Prime Minister Harper successfully weaponized the 2008 non-confidence crisis to strip legitimacy from coalitions, even though they’re mechanisms common in stable democracies like Germany. To achieve true electoral reform, the rules surrounding non-confidence votes will need to be changed to limit them to critical matters like budgets, corruption, or contempt of parliament — as is the case in Scotland. This shift would force elected officials to respect the electorate’s chosen representation, for it is time to treat governance as representative, not just a winner-take-all game. So:
- To those who vote: If coalitions can be made to work in other democracies, why not those in Canada?
- To those who oppose PR on these grounds: You just can’t get enough power, right? Oh dear... Now get to work and make it work like we asked you to!
Yet we have columnists like the National Post’s Kelly McParland, who, in a piece dating back to 2024, attempts to paint Germany’s PR system as a “disaster” and to trigger fear with alarmist phrases like “the sort of mishmash that often comes with proportional representation.” (I must say: Pretty balsy to pick on one of the holy grails of PR!) He then amplifies the fear by hammering on how “47 recognized parties” ran in the 2021 election before displaying his need for inertia by waxing poetic about FPTP — referring to it as the “old tried and true approach to voting” and going as far as declaring it “a system under which Canada has thrived for almost 160 years.” (Oh yeah? Since when has “thriving” and “inequity” been synonymous?) Then, when he’s done singing the praises of FPTP, he reverts to his stern warnings against electoral reform, characterizing elements of PR like party lists as “exotic features” that would threaten democratic accountability, nothing less!
McParland’s narrative relies on an unhealthy dose of omissions and innuendos. While hinting at a “chaotic” system, he ignores that Germany only had nine parties in its Bundestag after the 2021 federal election. In other words, he conveniently leaves out the strict 5% threshold, the crucial safety mechanism in a well-crafted PR system. Oh, and never mind mentioning that Canada only has roughly 20 recognized parties. Even the title of his article is a cheap shot. He muses that maybe the Liberals regretted having reneged on their promise to get rid of FPTP, like in those 1970s TV commercials, “I could’ve had a V8!” But this insinuation that they had wanted a PR system hides that they backed out of reform because they wanted an even worse majoritarian system than FPTP that would always favour them. If anything, McParland’s piece deserves a misinformation prize for relying on reader ignorance to turn democratic fairness into a fear-mongering tactic.
And then enters Christian Dufour, stage left. Or more accurately, stage right. As we dig through his arguments against PR for Québec, we quickly come to see that he is stuck in a kind of anachronism — one that refuses to consider that the relationship between Québec and Ottawa can be anything by adversarial, one that requires a strong “warlord” Québec premier à la Maurice Duplessis to counter those evil Feds, and one in which politics can only be viewed as a blood sport. Now, don’t get me wrong. I don’t look at politics through rose-coloured glasses that make me believe in the possibility of rainbows, unicorns, and a politicial class perpetually capable of reaching comprises. That’s never going to happen and, frankly, I don’t think it ever should! Strong, effective opposition is what keeps governments accountable.
However, the problem with Dufour is that he is a smart man who is capable of constructing a complex argument. But those arguments often fail the test of scrutiny, and when someone presents obvious counterarguments that dismantle his house of cards, he simply dismisses them out of hand — “persiste et signe,” as we say in French — and sticks to his dated views that are primarily based on fear.
- Point to the stability of PR-formed governments like those in Scotland or New Zealand? Oh, they’re not the same! (Subtext: They don’t have that nasty Ottawa to contend with.)
- He fears PR will lead to weak coalitions governments that would make Québec vulnerable in confrontations with Ottawa; he fails to see how a coalition backed by nearly 60% of voters would be far more credible and powerful than a fake supermajority backed by only 41% of voters, as was the CAQ following the 2022 election.
- He fears that the power base would move from the voters to backroom deals by political parties; he forgets, as I mentioned earlier, that parties already vet their candidates.
- He fears PR will fracture Québec’s francophone vote; he fails to notice that it’s already fractured, and that the only vote that isn’t is the anglophone vote... which is centered in Montréal... which primarily votes Liberal... and AH HA! You catch him with his pants down again!
Along with the word coalition, the word compromise has fallen on the wayside and been made to seem dirty in a majoritarian electoral system. Yet all worthwhile social endeavours require compromise, and heterogenenous inputs often lead to better, more nuanced solutions. I am sure no elected politician in Germany ever said that forming and maintaining a coalition is easy; however, who said that governing is or should be easy?
- “We wouldn’t know who won when we would go to bed on election night.”
- So? As if that has never happened?
Worse things could happen than not knowing at bedtime on election night the exact number of seats each party will have. Yet I can already hear PR opponents like Dufour on the night of a first PR election: “You see! You see! It’s been three hours since the polls closed and we still don’t know who won! What a mess, eh? Oh, this is all so confusing!” I mean, really? You seem addicted to instant gratification — or instant disappointment and outrage should you lose. Maybe you should get help for that.
Already, close local races have to go to a recount, and if some end up flipping to the candidate who was initially thought to be the second-place finisher, that would have an impact on the allocation of the regional seats. In other words, the proverbial dust may have to settle before we know the final counts, but that is not a sign that a PR system does not work or is confusing. It is simply that, as with many worthwhile endeavours, it can take a bit more time to do what is right. So:
- To those who vote: Give them time to count every vote and all will fall into place in the fullness of time.
- To those who oppose PR on these grounds: Calm down! We’ll all arrive at Easter at the same time.
The expectation that we should know all the winners a few hours after the polls close is, first, a modern phenomenon and, second, a by-product of two centuries of using majoritarian electoral systems that can provide decisive victories — even if a very large number of those victories were misaligned with what voters had expressed in the voting booth.
As the saying goes, “Haste makes waste.” It is true that the determination of a government can happen fast under FPTP. For example, the evening of the 2022 Ontario general election, the media declared a Progressive Conservative majority only 19 minutes after the polls closed! And then most people just as quickly moved on and accepted the majority/minority fiction that is based solely on the seat count, paying lip service to the fact that almost 60% opposed the government that had just been elected, and not realizing that the true winner of the election was Nobody. The waste in this case, as always, was presented as the “vote inefficiency” of the Greens and the Liberals — especially the Liberals — a concept wholly fabricated to excuse the biggest deficiency of FPTP. It is nonetheless shocking to see two parties receive almost the same number of votes, but the one that had 7,682 more getting nearly four times fewer seats.
 Ontario Ontario |
43 → 2022 :: 2 Jun 2022 — 26 Feb 2025 —  Majority PCO Majority PCO
| Summary |
Government |
Opposition |
Lost votes |
| Party |
Votes |
Seats |
Party |
Votes |
Seats |
Party |
Votes |
| # |
% |
% |
# |
# |
% |
% |
# |
# |
% |
Parliament: 43 Majority
Majority=63 Ab.Maj.: +21 G.Maj.: +42
Population [2022]: 14,996,014 (est.)
Eligible: 10,740,426 Particip.: 44.06%
Votes: 4,732,476 Lost: 276,196
Seats: 124 1 seat = 0.81%
↳ Elec.Sys.: FPTP: 124
↳ By acclamation: 0 (0.00%)
Plurality: Votes PCO Seats PCO
Plurality: ↳ +795,840 (+16.92%)
Plurality: ↳ Seats: +52 (+41.94%)
Position2: Votes OLP Seats NDP
|
Candidacies: 897 (✓ 124) m: 571 (✓ 77) f: 325 (✓ 46) x: 1 (✓ 1)
PCO 124 NDP 124 OLP 121 GPO 124 IND 40 NBPO 123 OP 105 OTH 136
|
PCO |
1,919,905 |
40.83 |
66.94 |
83 |
NDP
OLP
GPO
IND |
1,116,383
1,124,065
280,006
15,921 |
23.74
23.91
5.96
0.34 |
25.00
6.45
0.81
0.81 |
31
8
1
1 |
IND
NBPO
OP
OTH
REJ
ABS |
9,411
127,462
83,618
25,188
30,517
6,007,950 |
0.20
2.71
1.78
0.53
0.64
—— |
| OLP Won 23 fewer seats than the NDP which won 7,682 fewer votes.
IND One candidate officially ran as having no affiliation.
OTH → NOTA 28 LBT 16 PPO 13 FR 11 COMM 12 CO 11 OMP 17 CC 2 COR 3
OTH → PPPO 3 OPF 3 STSX 3 CENT 2 PPSN 2 NOP 2 PBP 2 CPJ 2 ERP 2 ALLI 2
|
|
The Liberals’ vote waste against the NDP only got worse in the next general election in 2025. Indeed, even with 574,077 more votes than the NDP, the Liberals won half as many seats, or just 14 to the NDP’s 27.
| Ontario |
44 → 2025 :: 27 Feb 2025 — Present — Majority PCO
| Summary |
Government |
Opposition |
Lost votes |
| Party |
Votes |
Seats |
Party |
Votes |
Seats |
Party |
Votes |
| # |
% |
% |
# |
# |
% |
% |
# |
# |
% |
Parliament: 44 Majority
Majority=63 Ab.Maj.: +18 G.Maj.: +36
Population [2024]: 16,124,116 (est.)
Eligible: 11,065,813 Particip.: 45.71%
Votes: 5,058,505 Lost: 187,346
Seats: 124 1 seat = 0.81%
↳ Elec.Sys.: FPTP: 124
↳ By acclamation: 0 (0.00%)
Plurality: Votes PCO Seats PCO
Plurality: ↳ +653,967 (+13.02%)
Plurality: ↳ Seats: +53 (+42.75%)
Position2: Votes OLP Seats NDP
|
Candidacies: 768 (✓ 124) m: 514 (✓ 78) f: 252 (✓ 44) x: 2 (✓ 2)
PCO 124 NDP 123 OLP 123 GPO 124 IND 41 NBPO 108 OTH 125
|
PCO |
2,159,060 |
42.99 |
64.52 |
80 |
NDP
OLP
GPO
IND |
931,016
1,505,093
242,320
33,669 |
18.54
29.97
4.82
0.67 |
21.77
11.29
1.61
0.81 |
27
14
2
1 |
IND
NBPO
OTH
REJ
ABS |
20,394
79,932
50,795
36,226
6,007,308 |
0.41
1.59
1.01
0.72
—— |
| OLP Won 13 fewer seats than the NDP which won 574,077 fewer votes.
OTH → OP 44 LBT 17 NOTA 13 COMM 7 OMP 12 CENT 5 FR 5
OTH → STSX 2 PPO 4 NOP 3 ALLI 5 PRGO 2 CC 2 PPSN 2 ERP 2
|
|
All that being said, Ontarians have become notorious in the 21st century for not turning out to vote, but the all-time lows reached in 2022 and 2025 perhaps reflect that they consider the electoral system to be a waste of their time as it does not “listen” to them anyway.
In case you’re thinking that I cherry-picked those elections to make a point, consider that in Nova Scotia in 2024, roughly the same scenario played out, with that province’s political equivalents: PCs, NDP and Liberal. The NDP got 7 seats more than the Liberals who barely held onto official party status despite obtaining just under 2,000 more votes than the NDP.
 Nova Scotia Nova Scotia |
66 → 2024 :: 26 Nov 2024 — Present — Majority NSPC
| Summary |
Government |
Opposition |
Lost votes |
| Party |
Votes |
Seats |
Party |
Votes |
Seats |
Party |
Votes |
| # |
% |
% |
# |
# |
% |
% |
# |
# |
% |
Parliament: 66 Majority
Majority=28 Ab.Maj.: +16 G.Maj.: +31
Population [2024]: 1,076,374 (est.)
Eligible: 793,913 Particip.: 44.89%
Votes: 356,371 Lost: 5,842
Seats: 55 1 seat = 1.82%
↳ Elec.Sys.: FPTP: 55
↳ By acclamation: 0 (0.00%)
Plurality: Votes NSPC Seats NSPC
Plurality: ↳ +106,196 (+30.00%)
Plurality: ↳ Seats: +34 (+61.82%)
Position2: Votes NSLP Seats NDP
|
Candidacies: 191 (✓ 55) m: 106 (✓ 36) f: 83 (✓ 18) x: 2 (✓ 1)
NSPC 55 NDP 54 NSLP 55 IND 4 GPNS 23
|
NSPC |
187,045 |
52.83 |
78.18 |
43 |
NDP
NSLP
IND |
79,068
80,849
3,567 |
22.33
22.83
1.01 |
16.36
3.64
1.82 |
9
2
1 |
IND
GPNS
REJ
ABS |
653
2,940
2,249
437,542 |
0.18
0.83
0.63
—— |
|
|
|
Interestingly — but in a bad way — this general election had the lowest turnout in Nova Scotia history, which suggests that the FPTP is bringing Nova Scotians, like Ontarians, to give up on the electoral process. In a province that used to have a reasonable turnout rate at general elections, it is now below 60% since 2006, although never before in the mid-40s like in 2024 — even at elections held during World War II. Of course, now the Liberals are crying for a change of the electoral system, but will likely wipe their tears and deny having cried the next time they form a (false) majority government.
But certainly the form of waste that everybody seems to understand is when the popular vote for one party should have reasonably yielded a few seats but did not, like when the Greens reached the respectable threshold of 6.8% of the votes nationwide in the 2008 federal election, not to mention that a very large proportion of the electorate didn’t even bother to vote.
 Canada Canada |
40 → 2008 :: 14 Oct 2008 — 1 May 2011 —  Minority CPC Minority CPC
| Summary |
Government |
Opposition |
Lost votes |
| Party |
Votes |
Seats |
Party |
Votes |
Seats |
Party |
Votes |
| # |
% |
% |
# |
# |
% |
% |
# |
# |
% |
Parliament: 40 Minority
Majority=155 Ab.Maj.: -12 G.Maj.: -22
Population [2008]: 33,127,520 (est.)
Eligible: 23,617,343 Particip.: 58.98%
Votes: 13,929,093 Lost: 1,149,194
Seats: 308 1 seat = 0.32%
↳ Elec.Sys.: FPTP: 308
↳ By acclamation: 0 (0.00%)
Plurality: Votes CPC Seats CPC
Plurality: ↳ +1,575,884 (+11.39%)
Plurality: ↳ Seats: +66 (+21.43%)
Position2: Votes LPC Seats LPC
|
Candidacies: 1,601 (✓ 308) m: 1,155 (✓ 239) f: 446 (✓ 69) CPC 307 LPC 307 BQ 75 NDP 308 IND 71 GPC 303 OTH 230
|
CPC |
5,209,069 |
37.65 |
46.43 |
143 |
LPC
BQ
NDP
IND |
3,633,185
1,379,991
2,515,288
42,366 |
26.26
9.98
18.18
0.31 |
25.00
15.91
12.01
0.65 |
77
49
37
2 |
IND
GPC
OTH
REJ
ABS |
52,478
937,613
64,304
94,799
9,688,250 |
0.38
6.78
0.45
0.68
—— |
| OTH → CHP 59 ML 59 LBT 26 PCP 10 COMM 24 ACT 20 MP 8
OTH → NRHI 7 NLF 3 FPNP 6 AAEV 4 WLP 1 WBP 1 PPP 2
|
|
The waste can also be quantified in missed opportunities to notice the emerging trends hidden in plain sight in the numbers. For example, everyone seemed surprised when the Action démocratique du Québec formed the official opposition in the Québec National Assembly in 2007, forcing the Québec Liberal Party to form the first minority government in that province in nearly 130 years. However, the evidence of the ADQ’s ascension was visible in the three previous general elections, which we would have seen coming if we had had a proportional system, not to mention that its supporters would have been heard sooner. Indeed, the ADQ’s initial performance in 1994 could have been seen as a fluke like with the Equality Party in 1989 but, nine years later, the 2003 general election provided clear reasons to stop believing that was the case — except that everybody continued to focus only on the seat count.
 Québec Québec |
35 → 1994 :: 12 Sep 1994 — 29 Nov 1998 — Majority PQ
| Summary |
Government |
Opposition |
Lost votes |
| Party |
Votes |
Seats |
Party |
Votes |
Seats |
Party |
Votes |
| # |
% |
% |
# |
# |
% |
% |
# |
# |
% |
Parliament: 35 Majority
Majority=63 Ab.Maj.: +15 G.Maj.: +29
Population [1994]: 7,184,599 (est.)
Eligible: 4,893,465 Particip.: 81.63%
Votes: 3,994,628 Lost: 250,722
Seats: 125 1 seat = 0.80%
↳ Elec.Sys.: FPTP: 125
↳ By acclamation: 0 (0.00%)
Plurality: Votes PQ Seats PQ
Plurality: ↳ +13,212 (+0.34%)
Plurality: ↳ Seats: +30 (+24.00%)
Position2: Votes QLP Seats QLP
|
Candidacies: 682 (✓ 125) m: 541 (✓ 102) f: 141 (✓ 23) PQ 125 QLP 125 ADQ 80 NPDQ 41 EP 18 IND 68 OTH 225
|
PQ |
1,752,298 |
44.74 |
61.60 |
77 |
QLP
ADQ |
1,739,086
252,522 |
44.40
6.45 |
37.60
0.80 |
47
1 |
NPDQ
EP
IND
OTH
REJ
ABS |
33,703
11,671
66,221
61,375
77,752
898,837 |
0.86
0.30
1.69
1.58
1.95
—— |
| ADQ First general election for this party.
OTH → NLP 103 SOV 19 GPQ 11 LMP 10 C 10 CWCQ 18 DQ 11 QIP 11 EPQ 9 ML 13 COMM 10
|
|
36 → 1998 :: 30 Nov 1998 — 13 Apr 2003 — Majority PQ
| Summary |
Government |
Opposition |
Lost votes |
| Party |
Votes |
Seats |
Party |
Votes |
Seats |
Party |
Votes |
| # |
% |
% |
# |
# |
% |
% |
# |
# |
% |
Parliament: 36 Majority
Majority=63 Ab.Maj.: +14 G.Maj.: +27
Population [1998]: 7,290,497 (est.)
Eligible: 5,254,482 Particip.: 78.32%
Votes: 4,115,169 Lost: 118,435
Seats: 125 1 seat = 0.80%
↳ Elec.Sys.: FPTP: 125
↳ By acclamation: 0 (0.00%)
Plurality: Votes QLP Seats PQ
Plurality: ↳ +27,618 (+0.68%)
Plurality: ↳ Seats: -28 (-22.40%)
Position2: Votes PQ Seats QLP
|
Candidacies: 657 (✓ 125) m: 514 (✓ 96) f: 143 (✓ 29) PQ 124 QLP 125 ADQ 125 PSD 97 EP 24 IND 38 OTH 124
|
PQ |
1,744,240 |
42.87 |
60.80 |
76 |
QLP
ADQ |
1,771,858
480,636 |
43.55
11.81 |
38.40
0.80 |
48
1 |
PSD
EP
IND
OTH
REJ
ABS |
24,103
12,543
7,418
27,680
46,691
1,139,313 |
0.59
0.31
0.18
0.67
1.13
—— |
The electoral system brought the “wrong winner” at the head of the seat count.
PSD Formed after the 1994 general election from the NDPQ.
OTH → BPQ 24 NLP 35 RAP 1 ML 24 QIP 20 COMM 20
COMM Last general election for this party before the merger of its political wing with l'Union des forces progressistes in 2002.
|
|
37 → 2003 :: 14 Apr 2003 — 25 Mar 2007 — Majority QLP
| Summary |
Government |
Opposition |
Lost votes |
| Party |
Votes |
Seats |
Party |
Votes |
Seats |
Party |
Votes |
| # |
% |
% |
# |
# |
% |
% |
# |
# |
% |
Parliament: 37 Majority
Majority=63 Ab.Maj.: +14 G.Maj.: +27
Population [2003]: 7,471,775 (est.)
Eligible: 5,490,363 Particip.: 70.56%
Votes: 3,874,143 Lost: 147,548
Seats: 125 1 seat = 0.80%
↳ Elec.Sys.: FPTP: 125
↳ By acclamation: 0 (0.00%)
Plurality: Votes QLP Seats QLP
Plurality: ↳ +487,282 (+12.74%)
Plurality: ↳ Seats: +31 (+24.80%)
Position2: Votes PQ Seats PQ
|
Candidacies: 644 (✓ 125) m: 470 (✓ 87) f: 174 (✓ 38) QLP 125 PQ 125 ADQ 125 UFP 73 EP 21 IND 36 OTH 139
|
QLP |
1,758,200 |
45.96 |
60.80 |
76 |
PQ
ADQ |
1,270,918
697,477 |
33.22
18.23 |
36.00
3.20 |
45
4 |
UFP
EP
IND
OTH
REJ
ABS |
40,319
4,051
8,611
45,653
48,914
1,616,220 |
1.05
0.11
0.23
1.19
1.26
—— |
| UFP Formed in June 2002 from the Party for Socialist Democracy and other leftist parties.
OTH → BPQ 56 GPQ 36 QCDP 24 ML 23
BPQ Best result for this party (0.60%).
|
|
38 → 2007 :: 26 Mar 2007 — 7 Dec 2008 — Minority QLP
| Summary |
Government |
Opposition |
Lost votes |
| Party |
Votes |
Seats |
Party |
Votes |
Seats |
Party |
Votes |
| # |
% |
% |
# |
# |
% |
% |
# |
# |
% |
Parliament: 38 Minority
Majority=63 Ab.Maj.: -15 G.Maj.: -29
Population [2007]: 7,674,385 (est.)
Eligible: 5,630,567 Particip.: 71.23%
Votes: 4,010,683 Lost: 347,070
Seats: 125 1 seat = 0.80%
↳ Elec.Sys.: FPTP: 125
↳ By acclamation: 0 (0.00%)
Plurality: Votes QLP Seats QLP
Plurality: ↳ +89,261 (+2.24%)
Plurality: ↳ Seats: +7 (+5.60%)
Position2: Votes ADQ Seats ADQ
|
Candidacies: 679 (✓ 125) m: 467 (✓ 93) f: 212 (✓ 32) QLP 125 ADQ 125 PQ 125 QS 123 IND 28 OTH 153
|
QLP |
1,313,664 |
33.08 |
38.40 |
48 |
ADQ
PQ |
1,224,403
1,125,546 |
30.84
28.35 |
32.80
28.80 |
41
36 |
QS
IND
OTH
REJ
ABS |
144,414
4,490
158,088
40,078
1,619,884 |
3.64
0.11
3.98
1.00
—— |
| First minority government in more than 120 years.
QS Formed on 4 February 2006 from the Union des forces progressistes and other leftist parties.
OTH → GPQ 108 ML 24 BPQ 9 QCDP 12
GPQ Best result for this party (3.85%).
|
|
However, following the 2008 election, the ADQ returned to the Assembly as a non-recognized opposition group and underrepresented compared to its share of the popular vote.
| Québec |
39 → 2008 :: 8 Dec 2008 — 3 Sep 2012 — Majority QLP
| Summary |
Government |
Opposition |
Lost votes |
| Party |
Votes |
Seats |
Party |
Votes |
Seats |
Party |
Votes |
| # |
% |
% |
# |
# |
% |
% |
# |
# |
% |
Parliament: 39 Majority
Majority=63 Ab.Maj.: +4 G.Maj.: +7
Population [2008]: 7,740,347 (est.)
Eligible: 5,738,811 Particip.: 57.43%
Votes: 3,295,914 Lost: 134,141
Seats: 125 1 seat = 0.80%
↳ Elec.Sys.: FPTP: 125
↳ By acclamation: 0 (0.00%)
Plurality: Votes QLP Seats QLP
Plurality: ↳ +224,295 (+6.91%)
Plurality: ↳ Seats: +15 (+12.00%)
Position2: Votes PQ Seats PQ
|
Candidacies: 651 (✓ 125) m: 448 (✓ 88) f: 203 (✓ 37) QLP 125 PQ 125 ADQ 125 QS 122 IND 30 OTH 124
|
QLP |
1,366,046 |
42.08 |
52.80 |
66 |
PQ
ADQ
QS |
1,141,751
531,358
122,618 |
35.17
16.37
3.78 |
40.80
5.60
0.80 |
51
7
1 |
IND
OTH
REJ
ABS |
6,506
78,054
49,581
2,442,897 |
0.20
2.40
1.50
—— |
OTH → GPQ 80 INP 19 ML 23 DPQ 1 QRP 1
|
|
Maybe the people of Québec did not like what they saw from the ADQ once it finally had a significant presence in the National Assembly, but FPTP dished out a harsher punishment on the ADQ than what the electorate had prescribed. Yet one has to wonder if the Québécois might have reached their verdict on the ADQ sooner under PR? Or if, conversely, the ADQ might have had the opportunity to develop its political muscles and taken root in the Assembly had it had from the beginning a number of seats commensurate to its popular support? But certainly the course of our political history would have been and would be different if we had had a PR electoral system.
In short, perhaps the only virtues of FPTP are that it is easy to understand and fast at producing results. However, those quickly-obtained results are misleading in the long term, only serve the winners’ immediate interests, and eventually lead to voters disengaging from the process, as evidenced by the Ontario and Nova Scotia general elections of the last two decades. I would rather go to bed on election night knowing that my my trip to the polls was truly worth it.
- “I think that those who want PR have a hidden agenda. Frankly, I think they want more than they deserve!”
- You mean like you’ve been getting since 1867? The joke goes like this...
A billionaire, a working man, and an immigrant are around a table on which there are 10 cookies. The billionaire takes 9 of them and then whispers to the working man, “That guy’s gonna steal your cookie.”
Substitute “a billionaire” with a party leader, “a working man” with a supporter of that party, and “an immigrant” with a non-supporter of that party. Over all these years of using majoritarian electoral systems, members of the political class have become accustomed to the idea that if they play their cards right, they could have near absolute power by winning more seats in their legislative assembly than they would if a fair voting system were in place. The “winner takes all” mentality, which prevails within voting systems like FPTP, leads to a mindset whereby “Anyone who is not like me” (or in my party) “does not deserve a place in the legislature.”
The fact is that with FPTP, just like when one plays cards, pure luck has as much a role in obtaining that “desirable” outcome of a majority as does crafting policies that will appeal to the electorate. But then it seems that when the label “majority” gets fixed onto a government, the winners get confused. They start to think that everybody is on their side. And that way of thinking can, in time, lead to hubris and catastrophic political decisions. My conclusion after years of observation is that the political class desires majority governments, while the people want good governance and to be heard by their elected officials, and the former is not the prescription for the latter.
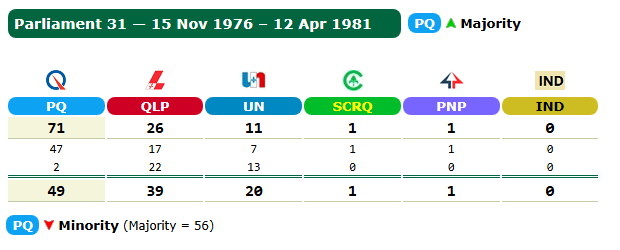
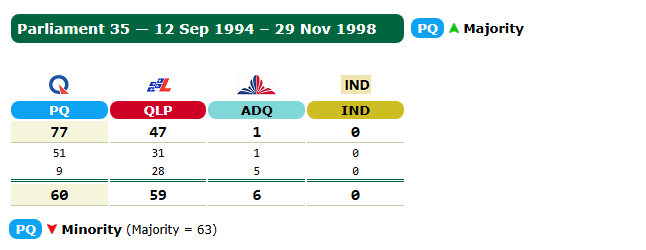
I do not wish to pick a fight with Québec sovereignists, but I posit that had the electoral system been proportional in 1976 and 1994, the Parti Québécois might have read the results differently and thought twice about attempting their referendums on sovereignty. I believe, as I examine these numbers, that the 1976 general election spoke as much about the Liberal Party’s wear of power as it did about a considerable number of people believing that Québec should become an independent nation, while the 1994 event might also have been speaking about wear of power but was mostly coloured by a decade of disappointing constitutional talks that came to naught. Le beau risque had failed...
| Québec |
31 → 1976 :: 15 Nov 1976 — 12 Apr 1981 — Majority PQ
| Summary |
Government |
Opposition |
Lost votes |
| Party |
Votes |
Seats |
Party |
Votes |
Seats |
Party |
Votes |
| # |
% |
% |
# |
# |
% |
% |
# |
# |
% |
Parliament: 31 Majority
Majority=56 Ab.Maj.: +16 G.Maj.: +32
Population [1976]: 6,234,445
Eligible: 4,020,608 Particip.: 85.33%
Votes: 3,430,952 Lost: 107,385
Seats: 110 1 seat = 0.91%
↳ Elec.Sys.: FPTP: 110
↳ By acclamation: 0 (0.00%)
Plurality: Votes PQ Seats PQ
Plurality: ↳ +255,295 (+7.59%)
Plurality: ↳ Seats: +45 (+40.91%)
Position2: Votes QLP Seats QLP
|
Candidacies: 556 (✓ 110) m: 510 (✓ 105) f: 46 (✓ 5) PQ 110 QLP 110 UN 108 SCRQ 109 OTH 75 NPDQ 21 IND 23
|
PQ |
1,390,351 |
41.37 |
64.55 |
71 |
QLP
UN
SCRQ
OTH |
1,135,056
611,666
155,451
31,043 |
33.78
18.20
4.63
0.92 |
23.64
10.00
0.91
0.91 |
26
11
1
1 |
OTH
NPDQ
IND
REJ
ABS |
20,787
3,080
13,072
70,446
589,656 |
0.62
0.09
0.39
2.05
—— |
| PQ First government formed by this party.
OTH → PNP 36 (✓ 1) DA 13 COMM 14 QWP 12
PNP Ephemeral party (1976–79) of social credit tendency.
|
|
35 → 1994 :: 12 Sep 1994 — 29 Nov 1998 — Majority PQ
| Summary |
Government |
Opposition |
Lost votes |
| Party |
Votes |
Seats |
Party |
Votes |
Seats |
Party |
Votes |
| # |
% |
% |
# |
# |
% |
% |
# |
# |
% |
Parliament: 35 Majority
Majority=63 Ab.Maj.: +15 G.Maj.: +29
Population [1994]: 7,184,599 (est.)
Eligible: 4,893,465 Particip.: 81.63%
Votes: 3,994,628 Lost: 250,722
Seats: 125 1 seat = 0.80%
↳ Elec.Sys.: FPTP: 125
↳ By acclamation: 0 (0.00%)
Plurality: Votes PQ Seats PQ
Plurality: ↳ +13,212 (+0.34%)
Plurality: ↳ Seats: +30 (+24.00%)
Position2: Votes QLP Seats QLP
|
Candidacies: 682 (✓ 125) m: 541 (✓ 102) f: 141 (✓ 23) PQ 125 QLP 125 ADQ 80 NPDQ 41 EP 18 IND 68 OTH 225
|
PQ |
1,752,298 |
44.74 |
61.60 |
77 |
QLP
ADQ |
1,739,086
252,522 |
44.40
6.45 |
37.60
0.80 |
47
1 |
NPDQ
EP
IND
OTH
REJ
ABS |
33,703
11,671
66,221
61,375
77,752
898,837 |
0.86
0.30
1.69
1.58
1.95
—— |
| ADQ First general election for this party.
OTH → NLP 103 SOV 19 GPQ 11 LMP 10 C 10 CWCQ 18 DQ 11 QIP 11 EPQ 9 ML 13 COMM 10
|
|
I wonder if René Lévesque and Jacques Parizeau weren’t both on some kind of electoral “adrenaline rush” because of FPTP, which may have clouded their judgment a bit when interpreting their electoral victories. To be clear, they did like everyone else: they focused on the number of seats they had won. However, the problem is that FPTP, which puts the emphasis only on that number, turned what should have been an invitation to compromise into an artificial blank cheque.
Indeed, these simulations demonstrate just how different the legislative reality in the National Assembly would have been had the electoral system been proportional. The course of Québec’s history would likely have taken a different turn. Let’s imagine first if Lévesque’s first government in 1976 had looked something like this:
- The first row shows what happened in 1976.
- The second estimates the number of local seats each party would have won.
- The third calculates the number of compensatory seats each would have received.
- And the last row adds the second to the third to give the alternate (proportional) composition of the government.
Now let’s imagine if Parizeau’s government in 1994 had looked something like this:
I am in no way trying to downplay the intellectual rigidity or the depth of the sovereignist convictions held by these two giants of Québec politics. But this in-depth analysis of the figures, which looks beyond mere seat counts, compels us to ask whether FPTP acted as a sort of optical illusion, even for such seasoned politicians. It is reasonable to hypothesize that had a proportional representation system been in place in 1976 and 1994, their interpretation of the results would have been vastly different. It was as if the strong seat majorities produced by the magnifying effect of FPTP gave them the illusion that the “conditions gagnantes” (winning conditions) were in place, thereby obscuring the razor-thin margins in the popular vote (notably the 0.34% margin in 1994). And because of this blind spot, they ultimately led themselves into what was (for them) a catastrophe.
I am not taking a stand for or against sovereignty, nor am I questioning the legitimacy of the referendums. I am simply saying that if we had had a more nuanced voting system — one that’s more able to capture what the electorate is trying to say in the voting booth — the course of our history would have been different: possibly less painful for some, and less heartbreaking for others. In fact, it was only by thinking about the billionaire joke and conducting this analysis that I was finally able to better understand the bitterness underlying Parizeau’s unfortunate comment about “money and some ethnic votes” on the night of the narrow referendum defeat in 1995.
I could find many similar examples from the 439 partisan general elections recorded in PoliCan, but with those I am risking getting subjective and partisan as to what constitutes a “catastrophe.” For some, the NDP’s “Social Contract” or the Conservatives’ “Common Sense Revolution” in Ontario in the 1990s were catastrophes but not for others. The manner in which the federal Liberals eliminated the deficit between 1993 and 2004 was a catastrophe for some, but others believe to this day that it just had to be done. This list could go on.
However, I feel at ease to make this one observation: the greater a party’s seat plurality or government majority, the more that party has free rein and, given that so few governments have been formed with a real majority of those who voted, the more likely the real majority will be upset and feel powerless during the course of that party’s mandate. It is infuriating to hear a government brag that it has the majority of Canadians or Manitobans or New Brunswickers or whoever on its side when that assertion is based on its inflated parliamentary majority that is backed by as few as 38% of those who voted!
But the saying that comes to my mind as I think about the above Québec examples is, “Be careful what you wish for.” Wishing for a legislative majority, and then getting it, can sometimes lead to political and tactical errors. And the simple fact remains that everyone, within reason, is deserving of representation. So:
- To those who vote: Demand to be represented as you have asked, and banish the thought that compromise is a bad thing.
- To those who oppose PR on these grounds: Your slip is more than showing and you need to put your sense of entitlement in check!
For indeed, in a healthy democracy, governing needs to be in tune with how the governed wish to be governed. If anyone has a “hidden agenda,” that would be those who benefitted from and therefore wish to preserve the unfair electoral system that has been chosen for us. Their agenda — the one they are hiding from you — is that they want to keep gaming the system so that they can satisfy their base which, almost always, constitutes a minority of the electorate.
Many of us gasp with horror and clutch our pearls when somebody in the room says, “Meh... my vote doesn’t count...” We rail when we see a voter turnout of only 44% to 45% at general elections. We pull out our hair trying to think of ways of getting people to exercise their franchise, especially young people. We disapprove when we hear others say that all political parties are the same. And we scratch our head after an election in which there’s a huge disconnect between vote and seat percentages.
I have long held that cynicism towards the political class, alone, is not the reason why so many refuse to engage in the political process. After poring through all the numbers, seeing how hopeless one can feel wanting to vote for Party X when Party Y has won every election in a riding for the last 60 years — I live in such ridings, provincially and federally — and hearing so much talk about how and why the system is broken, I have to admit they have a good reason to have become disaffected.
Our electoral system is indeed broken. It is tone deaf. It marginalizes legitimate points of view. It is predicated on exclusion rather than inclusion.
What if the system were designed in such a way that voting Green in Yarmouth or Liberal in Camrose would not be pointless? That it could hear those more quiet voices, provided they are in sufficient numbers? That it would not completely exclude some from the conversation?
Proportional representation could do that, and we would be better as a society for it. It would not be a panacea, but it would certainly not repel people from the polls. In fact, to the contrary, it could help restore confidence in our electoral system. Besides, doing the same thing over and over and wishing that everything will eventually fix itself is just magical thinking!
Isn’t the experience of nearly 160 years enough evidence that our problem isn’t just going to go away on its own?
But in order for us to succeed in effecting change...
© 2005, 2026 :: PoliCan.ca (
Maurice Y. Michaud)
Pub.: 9 May 2022 23:15
ET
Rev.: 28 Jul 2026 17:04
ET